This guide to the cardiac will cover 6 bits and bobs of the cardiac cycle:
- Relevant anatomy and phases of the cardiac cycle
- Wiggers diagram
- Volumes of the chambers of the heart
- Pressures of the chambers of the heart and aorta
- ECG
- Sounds of the heart
Phases of the cardiac cycle
Ih a single heartbeat a chain of events happen. They happen every heartbeat to pump blood, and they can speed up and slow down based on needs of the body. The chain of events involve contraction of cardiac muscle, which is triggered by electrical impulses. The contractions happen in such a way that blood in pumped efficiently and quickly.
The 4 pumps of the heart; Cardiac cycle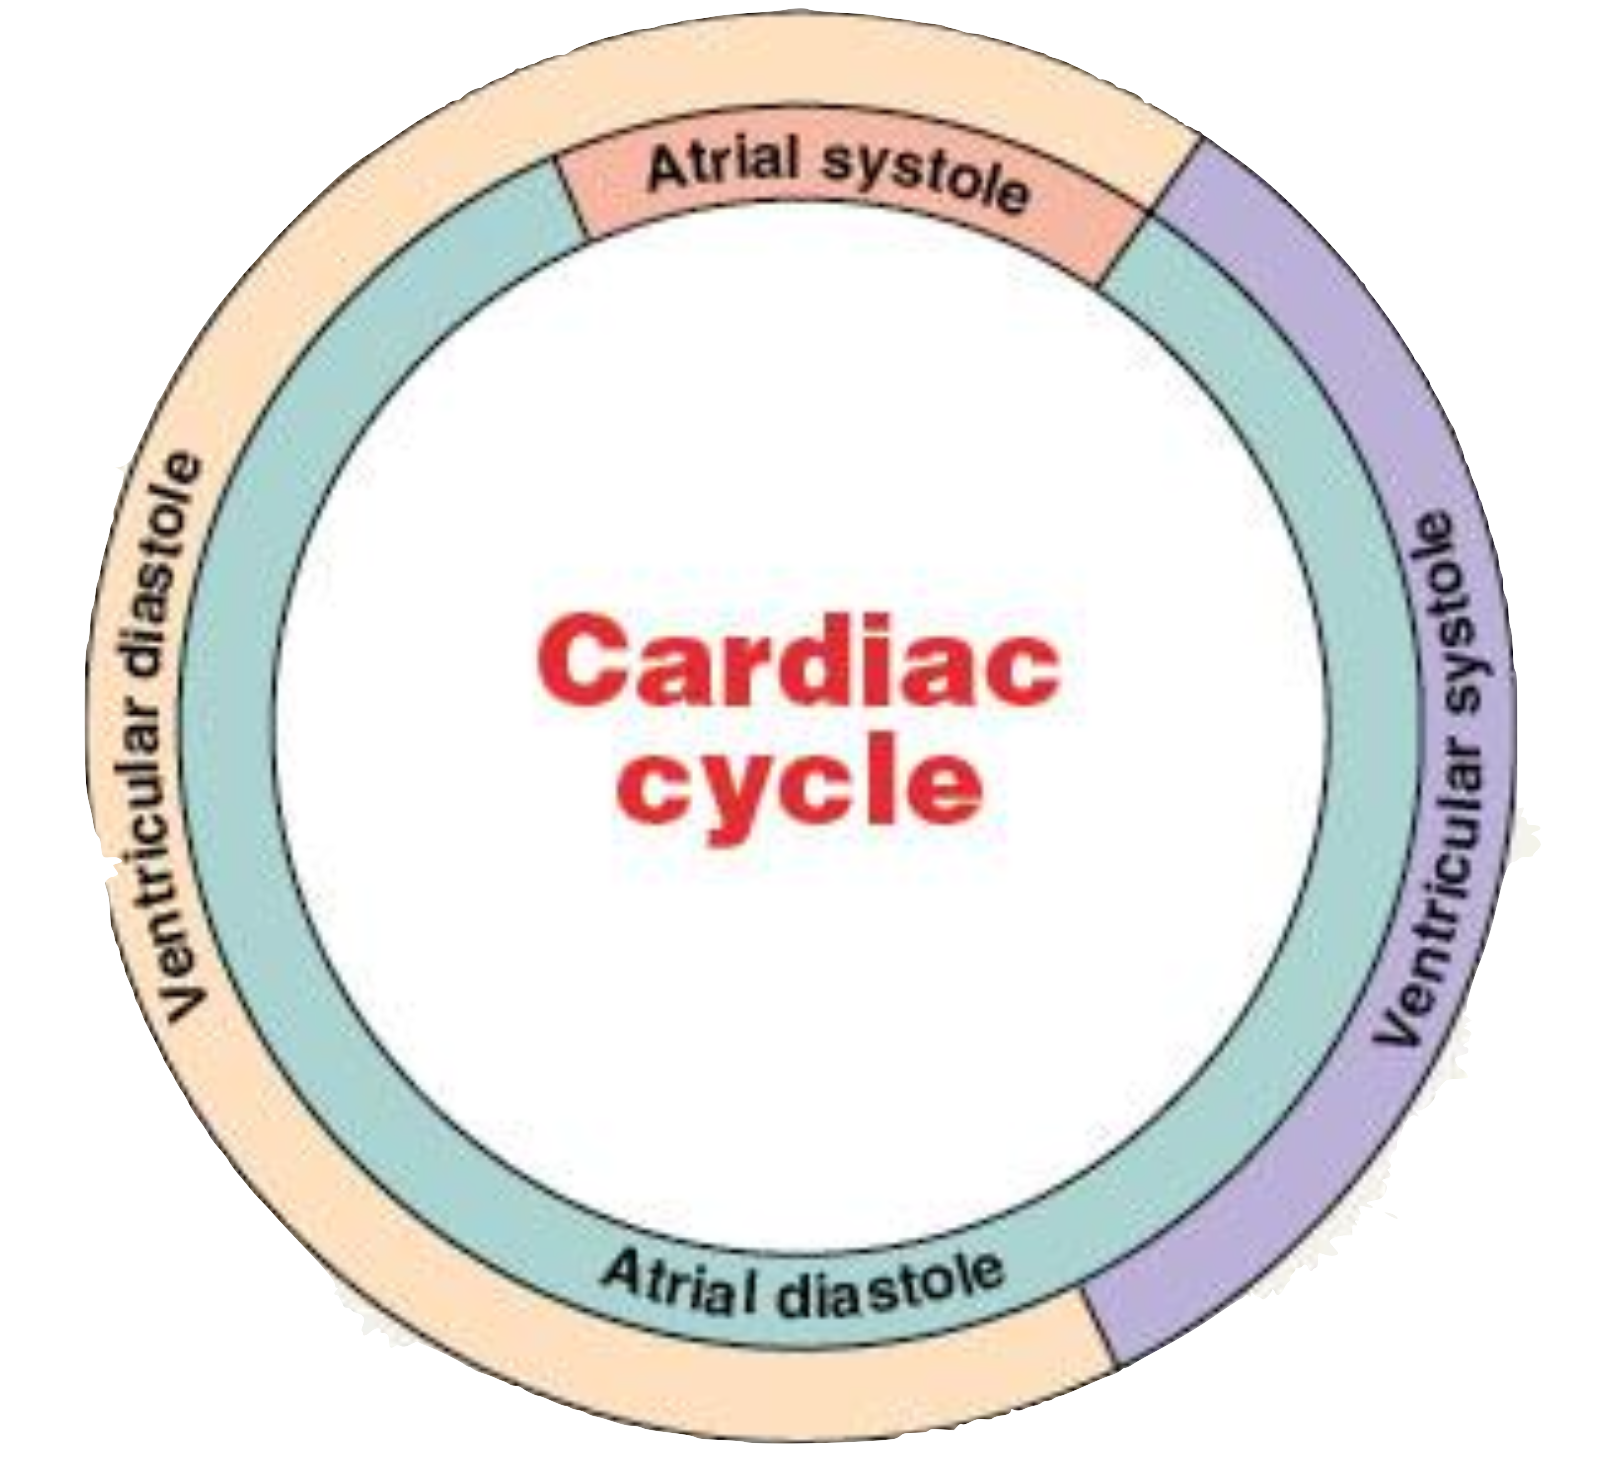
The heart is made of 4 pumps, 2 atria and 2 ventricles. In a heartbeat the left and right atria pump in tandem and the ventricles pump in tandem, albeit the latter pumps later. You can split the contraction cycle that each pair performs into 2 phases, diastole (Dia, meaning apart, stole from stel, or to put in place, together meaning dilation (greek)), and systole (sys, to draw together, stole/stel meaning to contract (greek)). These terms, dilation and contraction in entirely form the entire cardiac cycle (I mean the heart could only be contracting or not contracting there isn’t really a third option.) Ventricular diastole and systole each are split up into 2 further bits as well
The atria contract first, and as they contract they pump blood to the ventricles which then contract themselves and then they are both in diastole as per the chart.
1. The atrial systole
The atria contract, pushing blood (20% of EDV) into the ventricles through the Atrioventricular valves and filling them to EDV (end diastolic volume, the volume at which the ventricles are most, full and is just before contraction.) The ventricles are at low low pressure so there is no appreciable isovolumetric contraction.
2. Ventricular systole
Ventricular isovolumetric contraction
The ventricles contract, and the AV valves snap shut, but there is no movement of blood. It cannot go into the atria because the AV valves are shut, and it cannot go into the aorta (or pulmonary trunk) because the aorta/PT has significantly higher pressure then the ventricles do right now. so the blood just sits, and the ventricles keep contacting, until the pressure it higher than the aorta/PT to be continued…
Ventricular ejection
This occurs when the ventricles contract enough that the blood can then flow doent eh pressure gradient to the aorta/PT. The blood is pumped to the aorta/pt and the ventricles begin to contract with less and less force until the point where aortic (I will stop talking about the pulmonary truck because its less relevant but assume all the steps keep happening but with far less pressure) pressure is higher than left ventricular pressure, which is where the semilunar valves snap shut. At this point we move to diastole.
3. Ventricular Diastole
Ventricular isovolumetric relaxation
This is where the ventricles are relaxing bur blood doesnt move. once again the pressure in the aorta is too high for blood to flow into and the semi lunar valves are closed and the left atria has too low relative pressure to allow passive filling. Ventricular volume is at the minimum and we call this end systolic volume. eventually the ventricle walls relax to the point where…
Ventricular filling
Atrial pressure is higher than the ventricular pressure and blood flows to the ventricles. This happens passively and is called passive filling. This accounts for 80% of EDV
1. Atrial systole
We see the atria contract filling the ventricles and allowing depolarisation. its a cycle and this will repeat for your entire life. we forget that atria have diastole but they kinda just sit there
Increase in heart rate 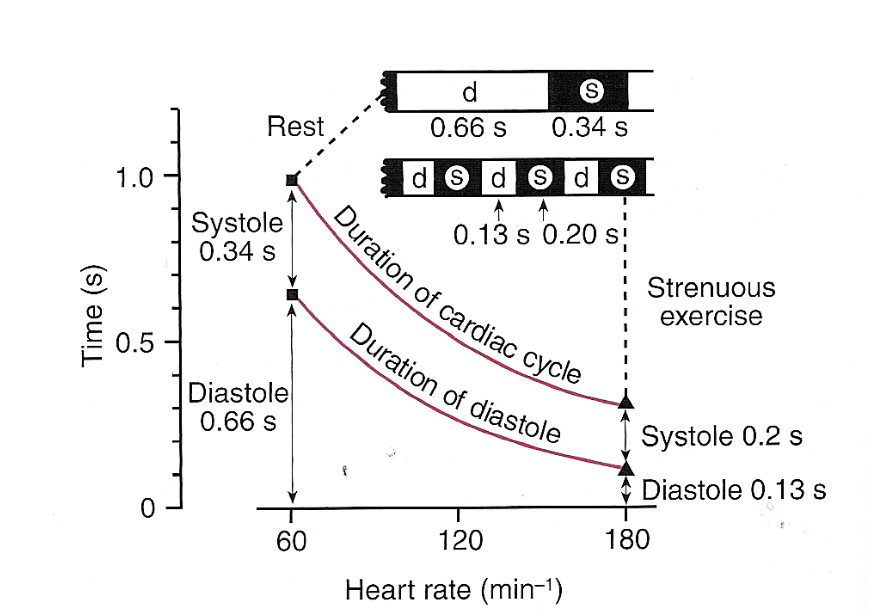
Most of the durations for cardiac cycles you are given in this assume 60bpm but the times dont change proportionally in increase of HR (and subsequent decrease in time per HR). as heart rate increases and time per beat decreases systole is for the most part maintained and diastole decreases. It is illustrated nicely in this diagram. you can see that while systole decreases diastole decreases more. This is able to happen because of the frank starling law, as your blood is pumping more when you exercise more blood is returned after, and your vein reduce the amount of blood held in capacitance
Wiggers diagram 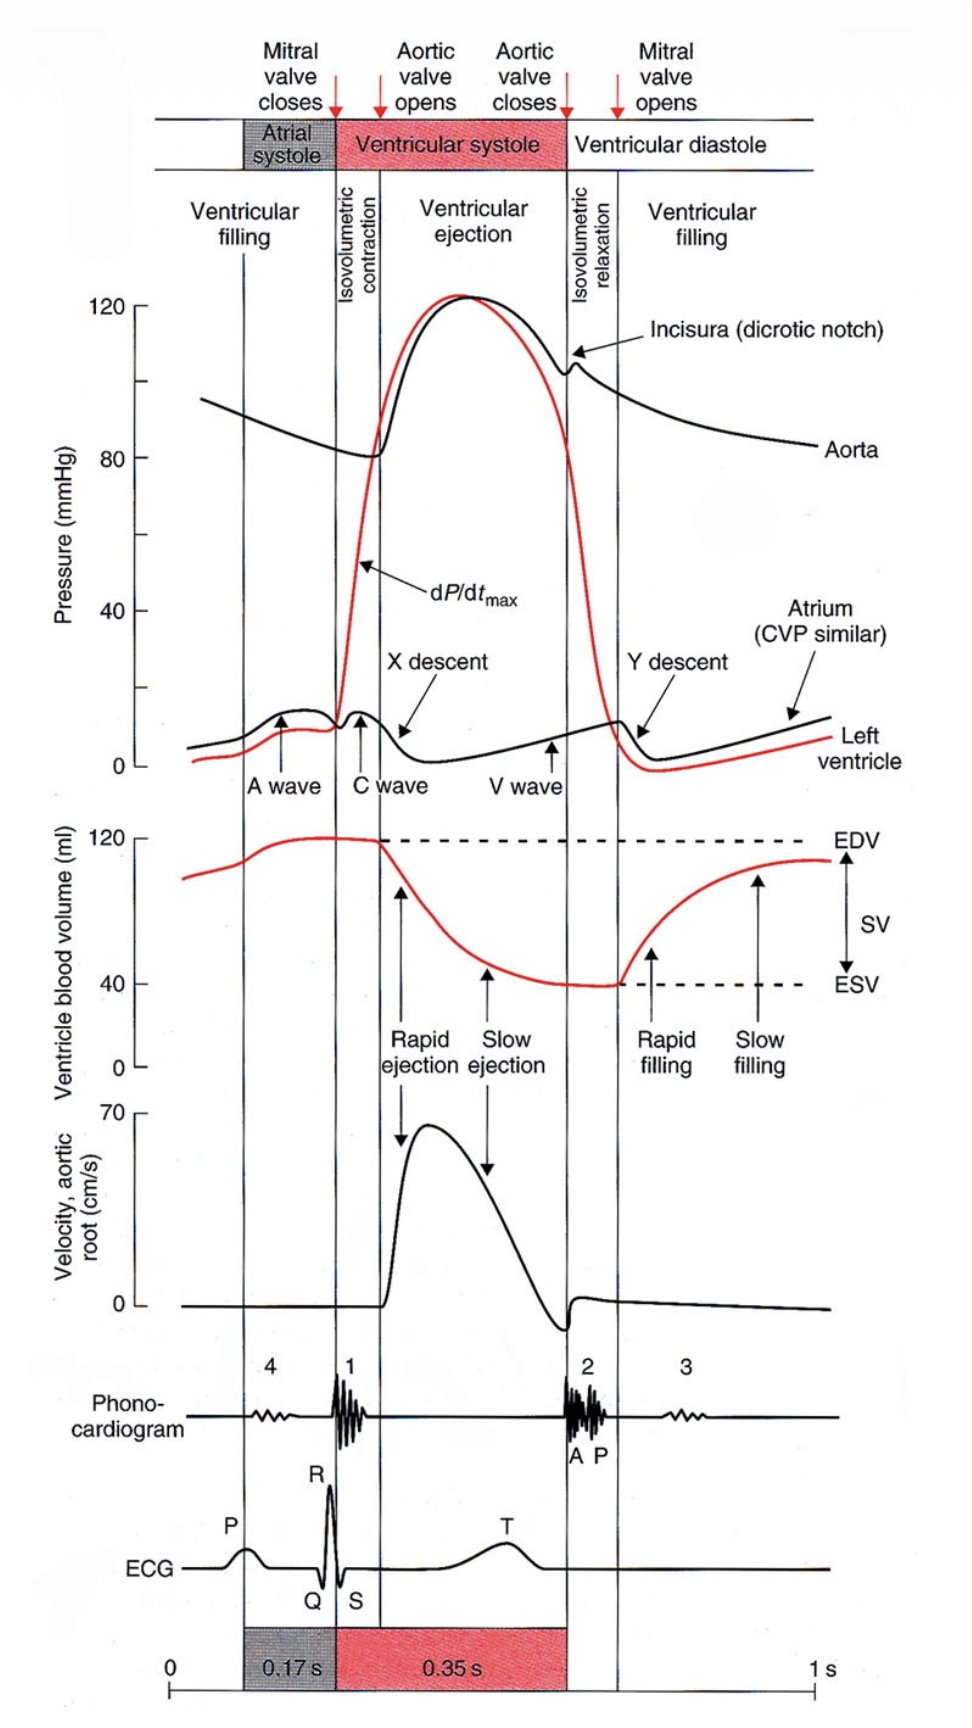
This is a diagram that brings together all of the pressures, volumes, and electrical signals together.
At the top you have valve operation and systoles, and then the lines mark the willing and isovolumetic contraction and relaxation
Then there is the pressure in each of the heart chambers and ventricle blood volumes. then you see the velocity of blood followed by heart sound, ECG and the times it takes for each at 60 BPM.
Lowkey I think it pays to just look over this graph and understand the compenents and how they relate to each other
Volumes
The relevant volumes are the concepts of: EDV: end diastolic volume, the highest volume the heart has, ESV: end systolic volume, the lowest volume the heart has, and SV: the amount pumped in each stroke, the different between EDV and ESV
Its also important to understand that the volumes can change based on signalling and frank-starling law etc.
Also you can see that blood ejected is not constant, it is rapidly ejected initially and rapidly filled initally, and in both cases is followed by slower ejection and filling.
Pressures
you can see how the pressures are rising and falling and the left ventricle pressure lifts the pressure of the aorta as the blood if pumped inside
ECG
You see on the graph the P wave showing depolarisation leading tto systolic contraction of the atrial, followed by the QRS complex showing the depolarisation leading to systolic contraction of the ventricled followed by repolarisation (T wave) of the vetnricles.
Sounds of the heart
On the graph you also see the sounds of the heart, which are associated with valve closures, the first sound (S1) is associated with initial contraction of ventricles closing the AV valves with pressure from contraction. We see the second sound (S2), associates with the start of the isovolumetric relaxation, closing the Semilunar valves